Organic Analysis Notes
Organic Analysis can be split into the below sections
· NMR
· Chromatography
· Test-tube Reactions
NMR
Nuclear Magnetic Resonance spectroscopy is a very powerful technique for determining the structures of molecules. The combination of Infrared spectroscopy, mass spectroscopy, and NMR can be used in combination to find the structure of organic molecules. NMR is most often performed on Hydrogen-1(proton) or Carbon-13, both are often used for the same samples.
Below is a typical Proton NMR spectra, it is of propanoic acid.
On the bottom axis there is the symbol δ which is for “chemical shift”, each hydrogen environment in a molecule has a different chemical shift value if it is in different environment. In propanoic acid there is three proton environments, so three peaks as indicated below.
The environments for protons are different even if they are slightly different, the amount of proton environments can vary significantly with small changes in molecules. The diagram has the different environments in different colours, while it looks complex the symmetry of the top molecule does make it easier.
Each peak has its own chemical shift, the value is then referenced to the data sheet.
Looking at the propanoic acid spectra above,
Peak 1 – 1.1ppm RCH3
Peak 2 – 2.3ppm RCOCH
Peak 3 - 11ppm RCOOH
We have now identified what the environments for the 3 peaks are. The integration of the peaks indicates the ratio of how many protons are in that environment. The integration of the above graph is
Peak 1 – 3
Peak 2 – 2
Peak 3 - 1
These integrations tell us that the hydrogens are in the ratio of 3:2:1
The final information that the proton NMR can tell is the splitting pattern, due to something called spin-spin coupling the amount of peaks tell us the location of the hydrogen. There is 4 splitting patterns we need to be aware of, anything greater than a 4 we will refer to a multiplet and is beyond the course.
The splitting pattern depends on the amount of hydrogens on the adjacent carbons, this is known as the n+1 rule where n is the number of hydrogens on adjacent carbons. Below are some example of splitting patterns in haloalkanes.
We can then identify the splitting in the propanoic acid spectra.
Peak 1 – Triplet, 2 adjacent hydrogens
Peak 2 – Quartet, 3 adjacent hydrogens
Peak 3 – Singlet, no adjacent hydrogens
We can summarise the information of the H-1 NMR spectrum as a table.
Carbon-13 NMR
Carbon 13 NMR is significantly simpler than H1-NMR, it provides only information about environment for carbons, it does not give information about location or abundance. The C-13 Spectra for propanoic acid is below.
We can see that there is 3 peaks, there must be only 3 carbon environments. Using the sheet we can identify these environments.
Peak 1 – 24ppm C-C
Peak 2 – 35ppm C-C=O
Peak 3 - 165ppm C-C=O in acid
With the information given from both NMR spectra, IP spectra and mass spec data the molecule can then be worked out. At A-level this is often only the final mark in a 6 to 8 mark question and bulk of the marks is from analysis of the spectra.
Preparing NMR samples
NMR samples must be dissolved in CCl4, carbon tetrachloride, or in deuterated solvent where all of the Hydrogen-1 atoms have been replaced with Hydrogen-2 atoms so will not show on a H1-NMR. Tetramethylsilane, TMS, is used as a standard for calibrating NMR machines it produces a very strong singlet at 0 δ ppm, by definition, so spectra will have a peak at 0 which is the TMS.
The peak at 0 is the TMS, the chemical shift is calibrated against this peak.
Chromatography
In chromatography solutes are separated by a mobile phase, the eluent, and a stationary phase.
Thin-layer chromatography TLC
A glass or metal plate is coated with a stationary phase, often silica. A baseline is drawn often in pencil, as it is insoluble in nearly all eluent and a sample placed on the baseline. The plate is then placed into a beaker with the eluent, the eluent is dependant on what is being separated, and a lid is placed on the beaker. A lid is placed on the beaker to ensure the atmosphere in the beaker is saturated with the solvent to minimise evaporation from the plate.
The retardation factor, Rf, is then calculated as a ratio of the distance moved by the spot to the distance moved by the eluent.
2-Dimensional TLC
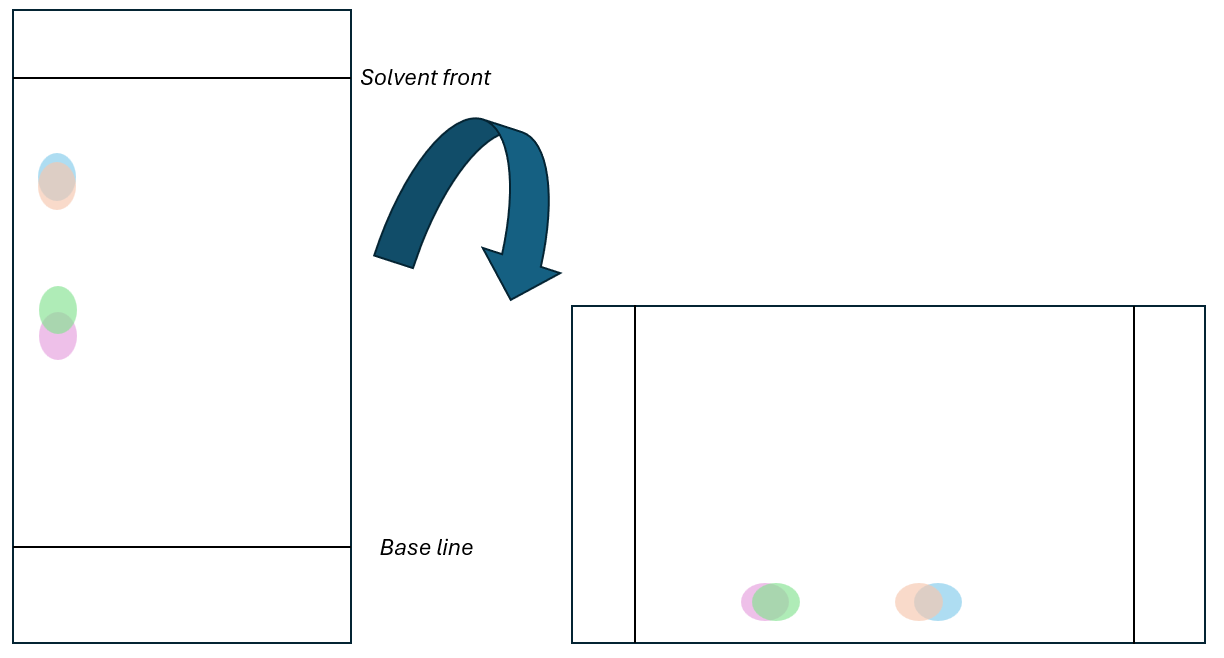
For some materials they will have similar Rf values in one eluent but drastically different in another, some amino acids show this. The TLC plate is ran in one solvent and then turned on its side and ran in another eluent which produces a 2D TLC plate.
Column Chromatography
Column chromatography is normally used to separate larger samples and the samples are collected after unlike TLC. The column is packed with a powder, again often silica, saturated with eluent and then the sample put in the top. More eluent is put in to the top and eluent tapped off the bottom. The samples are separated by the amount of eluent it takes for the sample to come out called retention factor, TLC is often used to check when different parts of the sample come out of the column.
Gas Chromatography GC
GC is an analytical technique which vapourised samples are combined with a carrier gas, as the eluent, and passed through a very long and thin column packed with silica as the stationary phase. The amount of time it takes for the sample to move through the column is recorded and is called the retention factor.
Test-Tube reactions
The below test tube reactions need to be remembered in both AS and A-level chemistry. Alcohol, Aldehyde, Alkene, Carboxylic Acid.


